C A M B R I D G E I N D U S T R I A L T R U S T
A N N U A L R E P O R T 2 0 1 5
/ 1 2
MANAGER’S REPORT
In FY2015, the Manager achieved a double-digit increase
in CIT’s portfolio NPI as compared to the prior year,
demonstrating resilience despite the difficult operating
environment. Growing the business in the light of an
increasingly competitive industrial property landscape
became challenging, as finding accretive acquisitions in
Singapore became difficult. Nevertheless, CIT acquired
one new property and completed the Cambridge LLP
Acquisition, for a total consideration of $27.2 million.
The 51 properties in CIT’s portfolio preserved their asset
value, which stood at $1.42 billion at 31 December 2015.
Portfolio occupancy was 94.3% as at 31 December 2015
which is well above JTC’s average industrial market
occupancy of 90.6%
1
.
The Manager continued to proactively manage lease
expiries and improve the tenant mix to strengthen CIT’s
portfolio. During FY2015, the Manager renewed more
than 1 million sq ft of space, with a pleasing weighted
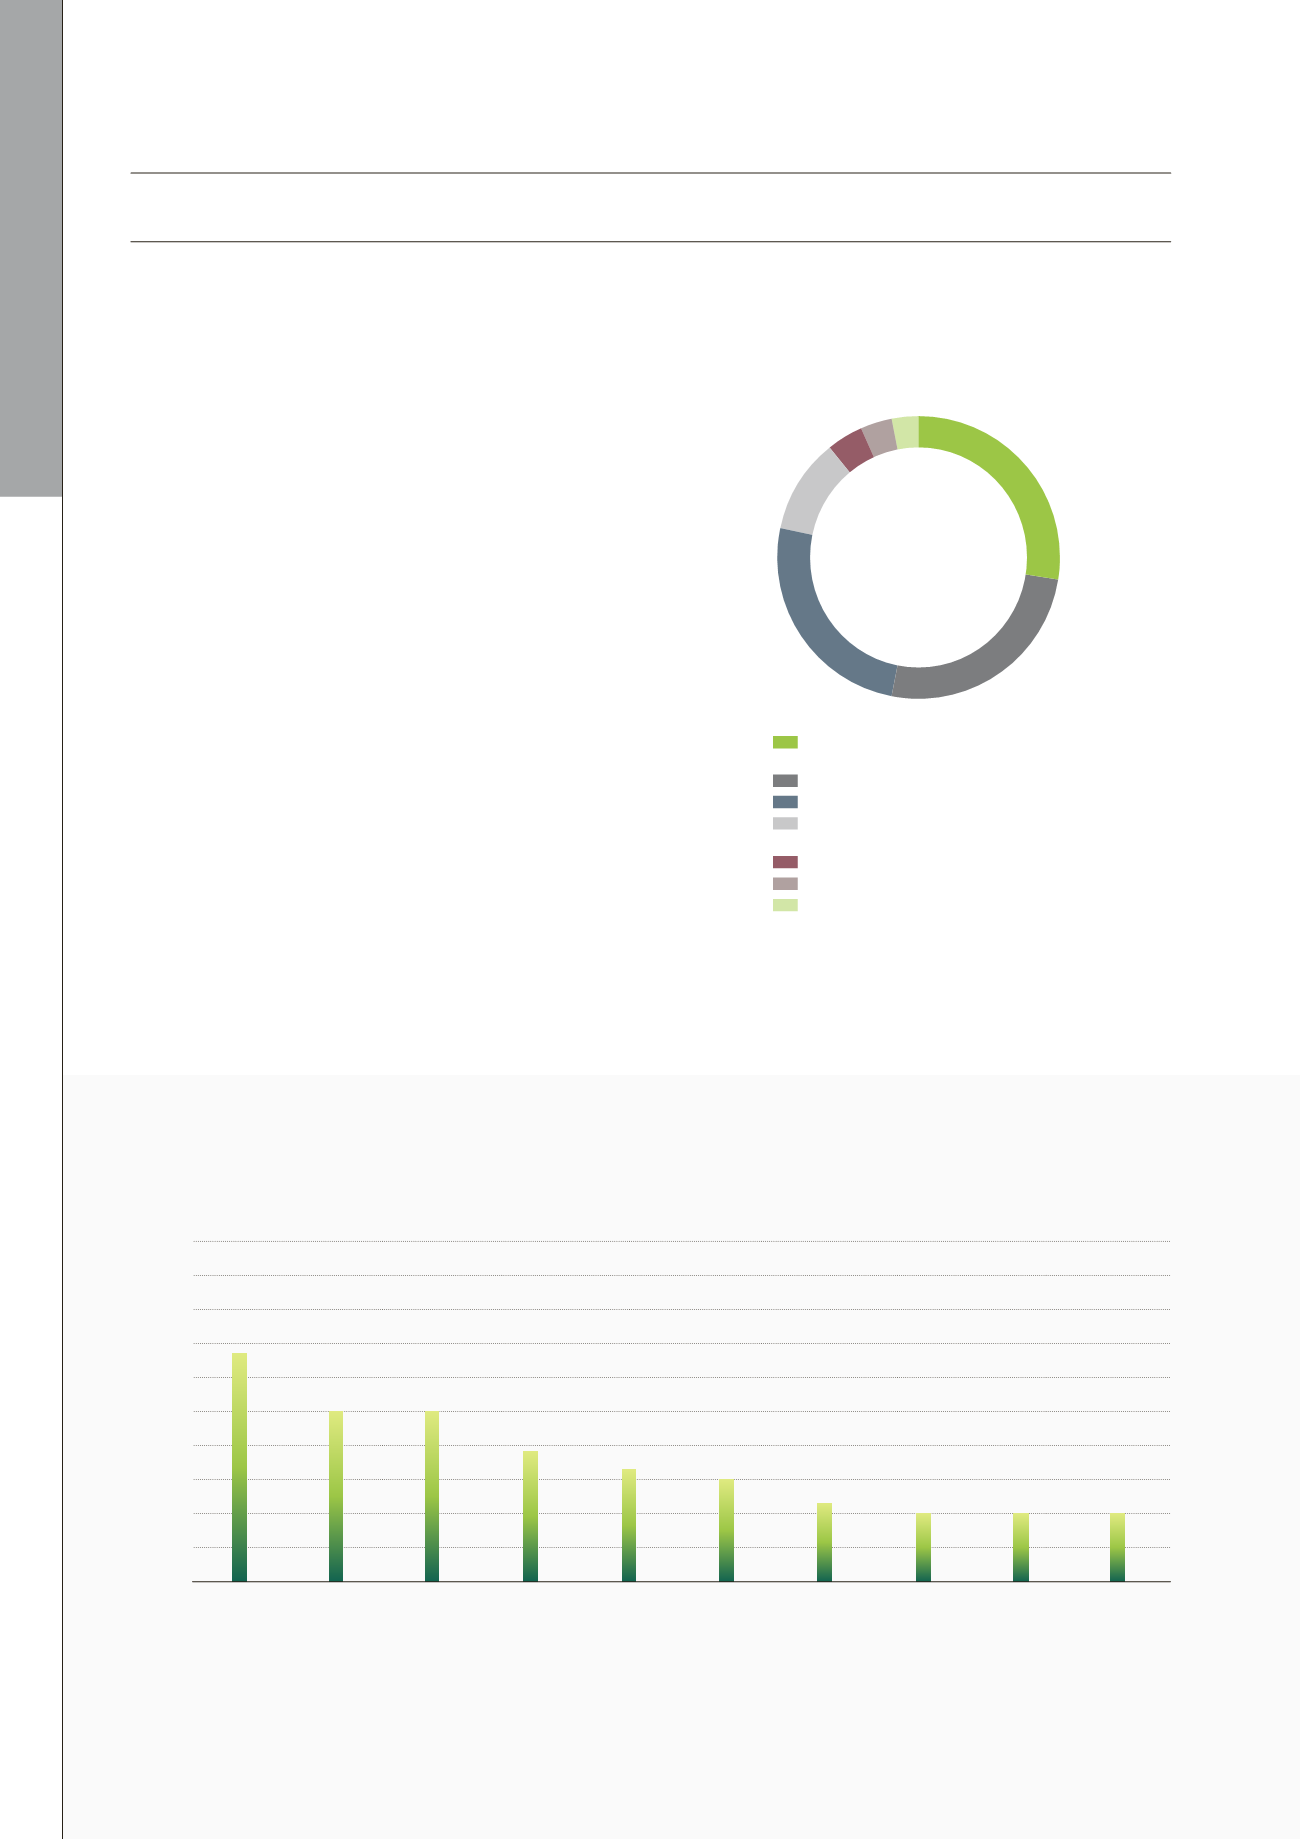
average rental reversion of 9.1%. With a diversified tenant
base of 187 tenants, the top 10 tenants accounted for
approximately 35.1% of rental income as at 31 December
2015. The WALE stood at 3.8 years, and the average
portfolio rent was $1.27 psf per month as at 31 December
2015.
1 JTC 4
th
quarter market report (%).
Tenant Classification Main Trade Sectors
As at 31 December 2015
10.0
9.0
8.0
7.0
6.0
5.0
4.0
3.0
2.0
1.0
0
HG Metal
Manufacturing
Limited
Beyonics
International
Pte Ltd
CWT
Limited
Soon
Wing
Investments
Pte Ltd
Hoe
Leong
Corporation
Ltd
Compact
Metal
Industries
Ltd
Nobel
Design
Holdings
Ltd
Tellus
Marine
Engineering
Pte Ltd
Venture
Corporation
Limited
Eurosports
Auto
Pte Ltd
6.7
5.0
5.0
3.8
3.3
3.0
2.3
2.0
2.0
2.0
Wholesale, Retail Trade
Services and Others
27.6%
Manufacturing
25.4%
Construction
4.2%
Other Services
3.4%
Precision Engineering
3.0%
Professional, Scientific and
Technical Activities
10.8%
Transportation and Storage 25.6%
Top Tenants Account for 35.1% Rental Income
As at 31 December 2015
%


