/ 4 8
C A M B R I D G E I N D U S T R I A L T R U S T
A N N U A L R E P O R T 2 0 1 5
SINGAPORE INDUSTRIAL PROPERTY MARKET OVERVIEW
3 FEBRUARY 2016
Prepared by DTZ Debenham Tie Leung Property Management Services Pte Ltd for the purpose of this Annual Report.
1.0 SOCIO-ECONOMIC OVERVIEW
1.1
GDP Growth, Unemployment And Inflation
Given its open economy, Singapore was affected by the uneven global economic growth in 2015. On a positive
note, the global economy was buoyed by the stronger-than-expected economic growth in the US. In particular,
the US Federal Reserve raised interest rates in December 2015, the first time since 2006. On the other hand, the
Eurozone’s economy remained lacklustre. Mainland China’s economy also slowed, as a result of overcapacity and
weakened exports. With Mainland China being Singapore’s largest trading partner, the slowdown weighed on
Singapore’s economy, particularly its export-oriented industries.
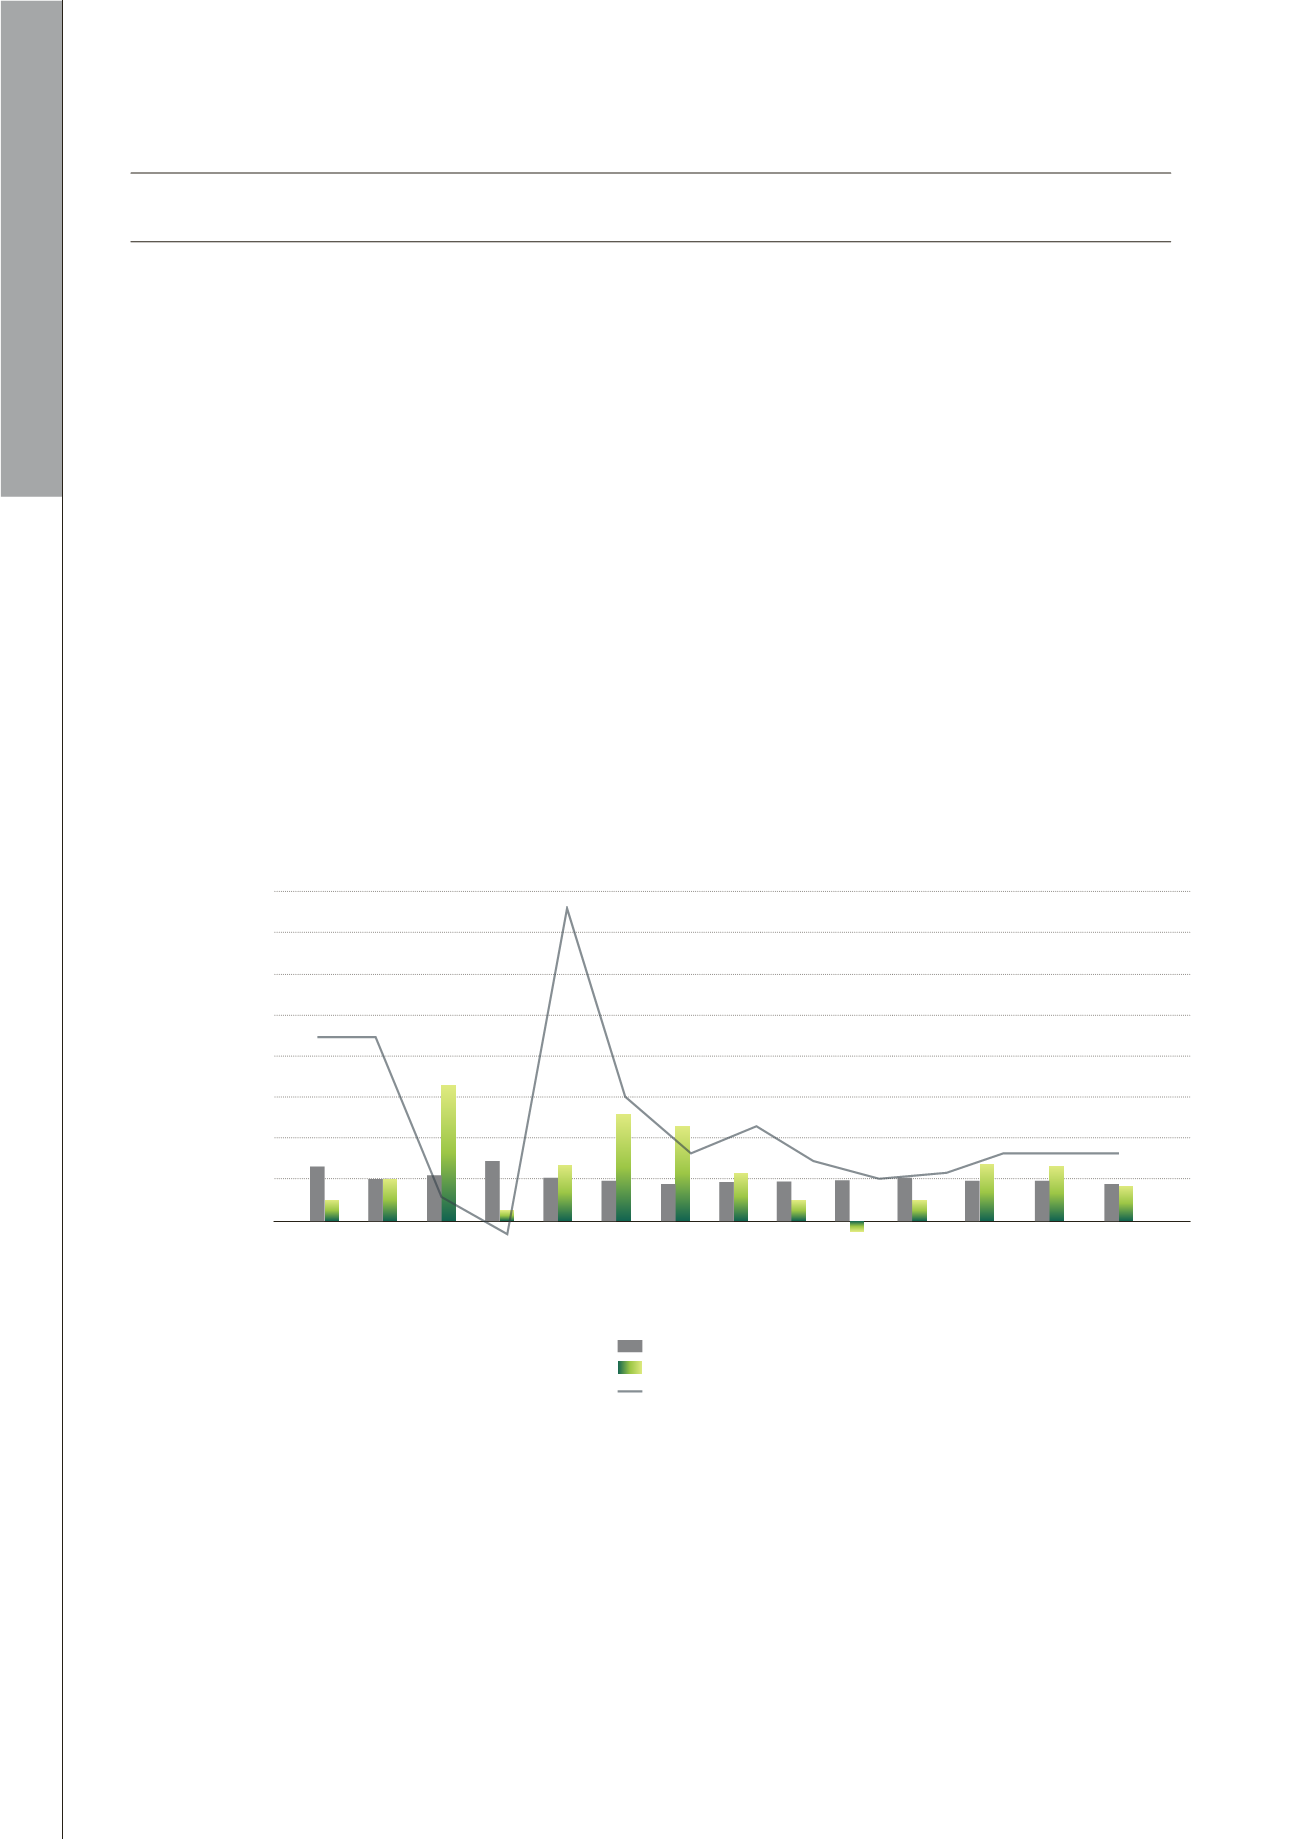
According to the Ministry of Trade and Industry (MTI), Singapore’s economy grew modestly by 2.0% in 2015,
compared with 3.3% in 2014 (Figure 1.1). The moderation was partly due to economic restructuring.
Figure 1.1: Real Gross Domestic Product Growth, Inflation and Unemployment Rate
Source: Oxford Economics, Department of Statistics of Singapore (DOS), DTZ Consulting & Research, February 2016.
Meanwhile, inflation eased since mid-2014. For 2015, inflation was -0.5%, down from 1.0% in 2014.
Overall unemployment rate in 2015 (1.9%) was broadly unchanged since 2011. Although total employment
continued to grow by 31,800 in 2015, it was the lowest since 2003.
The manufacturing sector, which drives the demand for industrial space, was affected by the slowdown in Mainland
China’s economy. According to the Economic Development Board (EDB), overall manufacturing output fell by
5.2% in 2015. The latest Purchasing Managers’ Index in January 2016 also reflected that the sector contracted for
six consecutive months since June 2015.
%
16.0
14.0
12.0
10.0
8.0
6.0
4.0
2.0
0.0
-2.0
2006 2007 2008 2009 2010 2011 2012 2013 2014 2015 2016F 2017F 2018F 2019F
Unemployment Rate
Inflation
Real GDP Growth


