/ 5 6
C A M B R I D G E I N D U S T R I A L T R U S T
A N N U A L R E P O R T 2 0 1 5
5.0 WAREHOUSE PROPERTY MARKET OVERVIEW
5.1
Supply
Total private warehouse stock increased by 5.7% (5.1 million sq ft) to 94.6 million sq ft in 2015.
Notable completions include DHL Supply Chain Advanced Regional Centre (811,000 sq ft) at 1 Greenwich Drive,
Space @ Tampines (610,000 sq ft) at Tampines Industrial Crescent and a single-user warehouse (103,000 sq ft) at
Buroh Lane by Warehouse Logistics Net Asia Pte Ltd.
5.2
Demand and Occupancy
Following the peak supply and demand for private warehouse space in 2014, the private warehouse market
slowed in Q1 2015. Demand contracted to -742,700 sq ft, leading to a five-year low occupancy rate of 89.9%.
Notwithstanding the weak transport and storage sector, demand picked up to 2.2 million sq ft and 1.97 million sq
ft in Q2 and Q3 2015 respectively. In Q4 2015, demand was significantly weaker at 0.9m sq ft. Demand declined by
43% to 4.3 million sq ft in 2015.
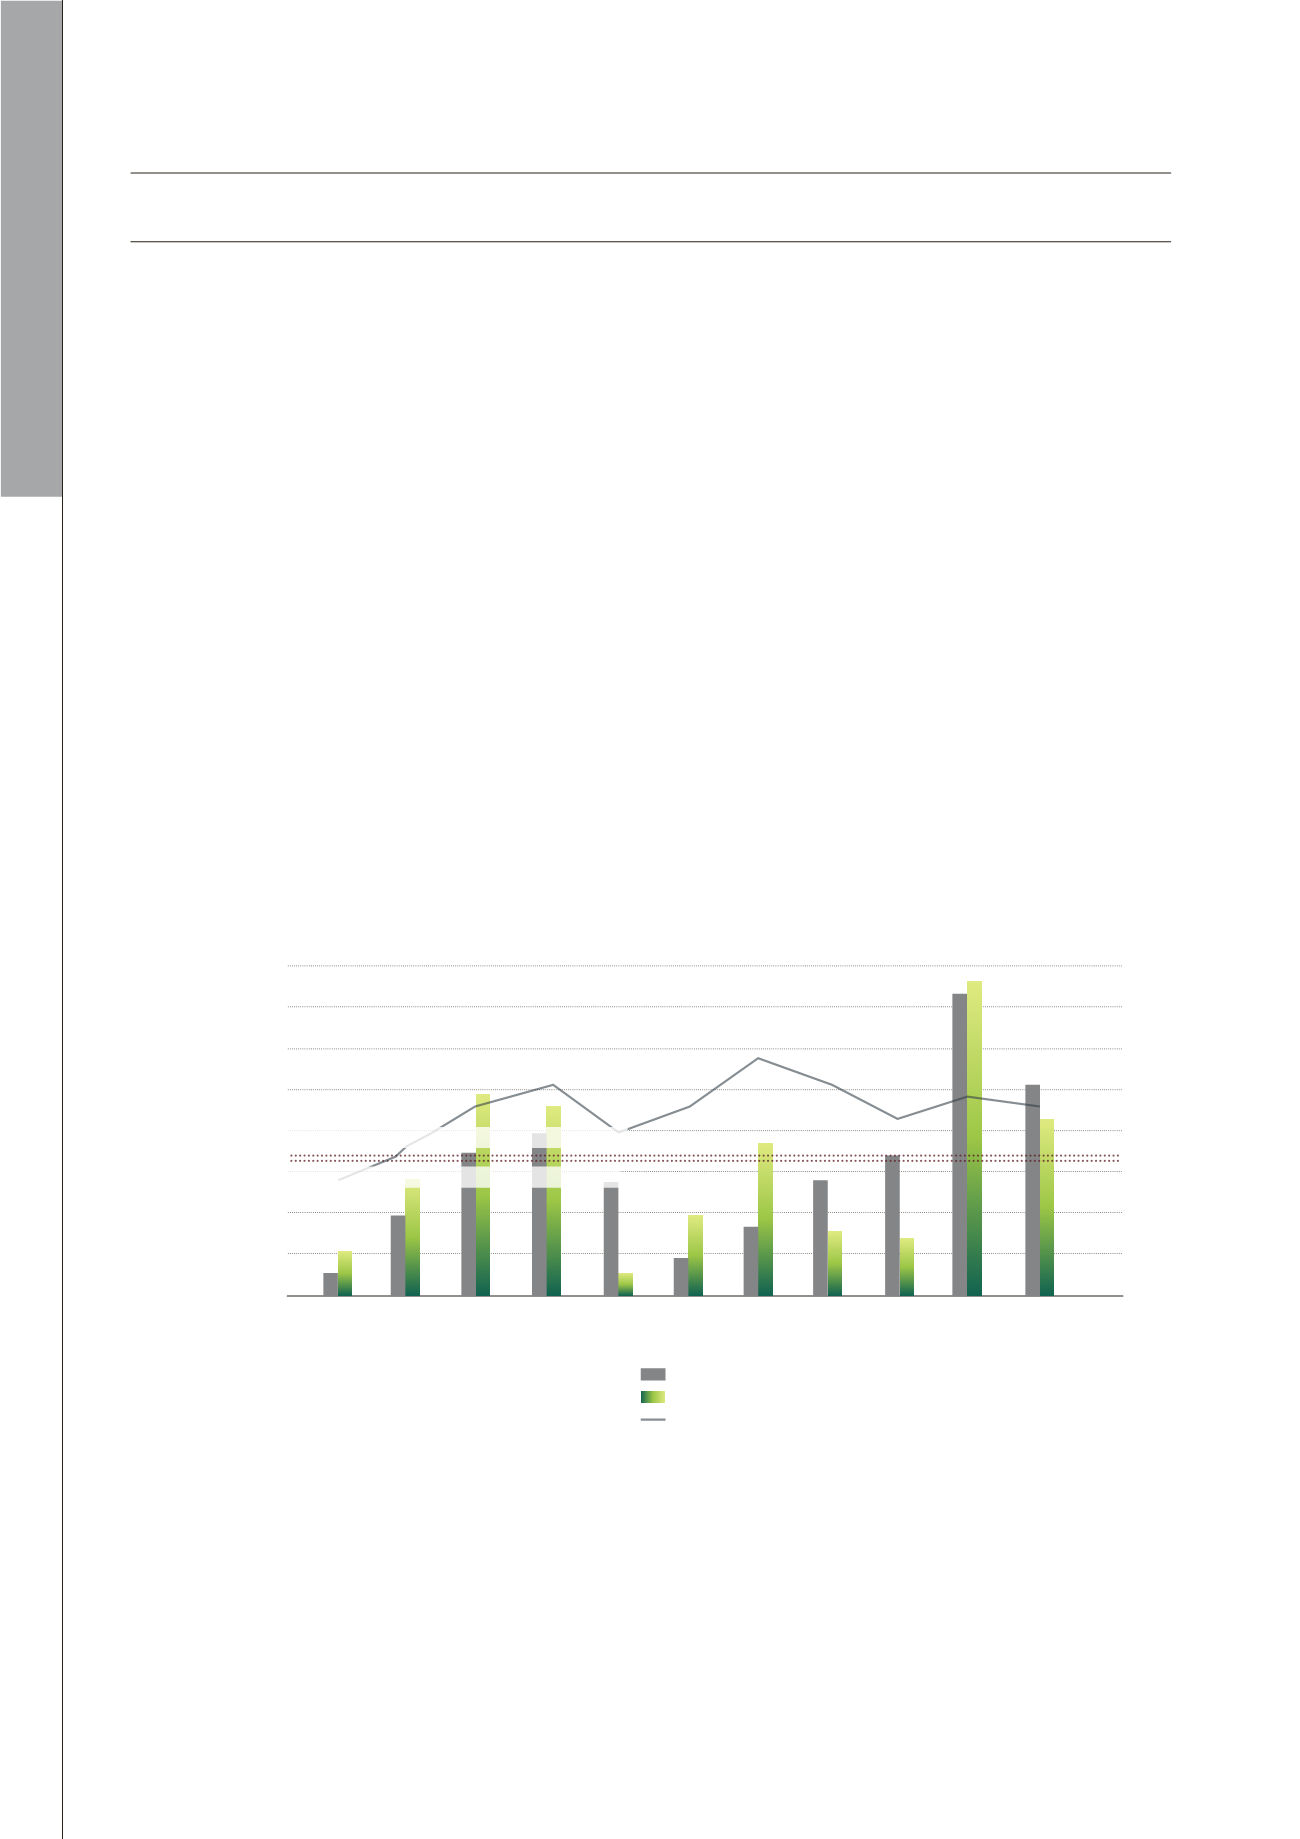
Net supply (5.1 million sq ft) was higher than the demand (4.3 million sq ft) in 2015. This led to a slight decline in
occupancy by 0.4% points, from 91.8% in Q4 2014 to 91.4% in Q4 2015 (Figure 5.1).
While weakness in the manufacturing sector weighed down growth of the warehouse market, the logistics
and distribution segment received support from the government. In 2015, the government announced pilot
programmes to boost productivity in the logistic sector. This includes a $20 million grant to support integrated
and shared delivery systems, with emphasis placed on the “last mile” of delivery.
5.3
Potential Supply
About 13.7 million sq ft of private warehouse space is in the pipeline for 2016 to 2018 (Figure 5.2). Notably, average
annual supply between 2016 and 2018 (4.6 million sq ft) is higher than average annual supply of 3.1 million sq ft in
the past decade (Figure 5.2).
SINGAPORE INDUSTRIAL PROPERTY MARKET OVERVIEW
Figure 5.1: Net Supply, Demand and Occupancy
Supply (LHS)
Demand (LHS)
Occupancy (RHS)
‘000 sq ft
8,000
7,000
6,000
5,000
4,000
3,000
2,000
1,000
0
91.4%
100%
98%
96%
94%
92%
90%
88%
86%
84%
82%
80%
2005 2006 2007 2008 2009 2010 2011 2012 2013 2014 2015
Source: URA, DTZ Consulting & Research, February 2016.
Average Annual Demand (2005 to 2014): 3,204,000 sq ft
Average Annual Supply (2005 to 2014): 3,139,000 sq ft


