/ 6 0
C A M B R I D G E I N D U S T R I A L T R U S T
A N N U A L R E P O R T 2 0 1 5
6.2
Demand and Occupancy
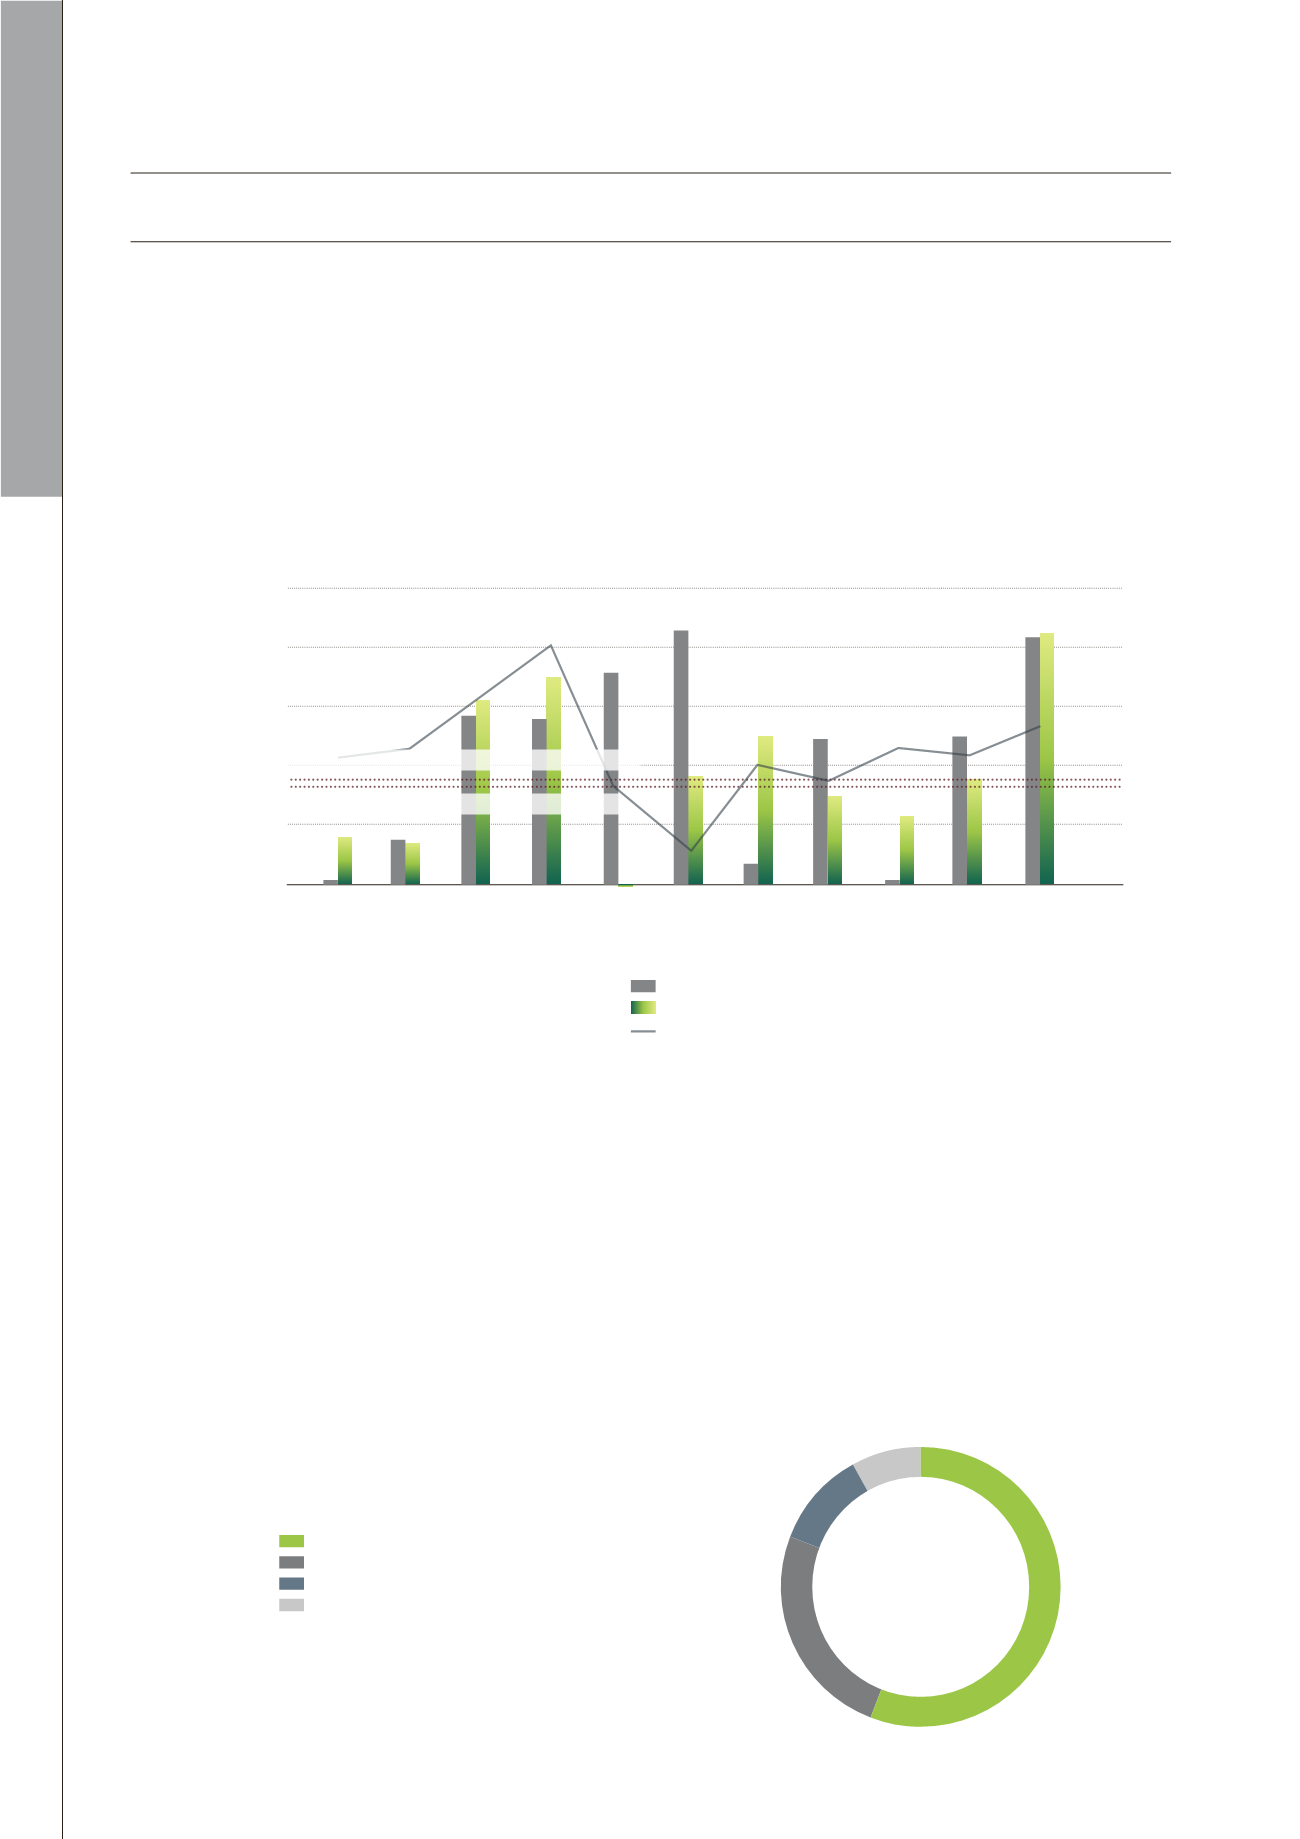
The demand of 2.1 million sq ft in 2015 is marginally higher than the net supply of 2.0 million sq ft. Demand in
2015 was the highest in the last decade, pushing occupancy higher from 81.1% in Q4 2014 to 83.7% in Q4 2015
(Figure 6.1).
In 2015, CSC Computer Services moved from Twenty Anson to BizHub East (28,000 sq ft), while DSM Nutritional
moved from 2 Havelock Road to Mapletree Business City (17,200 sq ft). In addition, some overseas companies
set up their offices in business parks, e.g. HAITE Group took up 185,000 sq ft of space in Changi Business Park,
while Seagate Technology opened a new $100m design and Research & Development (R&D) center (361,000 sq
ft) in Fusionopolis.
6.3
Potential Supply
There will be around 1.6m sq ft of business park space completing in 2016. Currently, there is no business park
development planned beyond 2017 (Figure 6.2). With significant scheduled completion dominated by Mapletree
Business City Phase II (0.9 million sq ft), potential supply in 2016 is higher than the average annual supply of
970,000 sq ft in the past decade.
SINGAPORE INDUSTRIAL PROPERTY MARKET OVERVIEW
Figure 6.1: Net Supply, Demand and Occupancy
‘000 sq ft
2,500
2,000
1,500
1,000
500
0
-500
83.7%
100%
96%
92%
88%
84%
80%
76%
72%
68%
64%
60%
2005 2006 2007 2008 2009 2010 2011 2012 2013 2014 2015
Average Annual Supply (2005 to 2014): 0.83 million sq ft
Average Annual Demand (2005 to 2014): 0.97 million sq ft
Supply (LHS)
Demand (LHS)
Occupancy (RHS)
Source: URA, DTZ Consulting & Research, February 2016.
Source: URA, DTZ Consulting & Research, February 2016.
Figure 6.2: Potential Supply (2016)
Mapletree Business City Phase II (915,827 sq ft)
56%
Ascent (417,577 sq ft)
25%
Business park development (126,659 sq ft)
8%
MediaHub (189,150 sq ft)
11%


